
Data
Citoyen for media and education
Every figure on Citoyen can leave the site: in an article, a presentation or a lesson. It keeps its official producer, its period and its link to the original series, and updates itself once you embed it.
Embed a card
The “Embed” button of every full-screen card gives a code to paste into any tool that accepts an iframe (WordPress, Moodle, Notion…). The card updates with each new figure: the article or the lesson stays right without any edit.
You choose: figure, chart or both; line, bars or table; period; up to 5 countries compared; terms of office, reforms and crises on the line; light, dark or automatic theme.
Live example: unemployment in France, compared with Germany and Italy
The matching code
<iframe src="https://citoyenapp.com/embed/en/FR/unemployment-rate?v=1&range=5y&compare=DE,IT" width="100%" height="400" style="border:0" loading="lazy" title="Embedded Citoyen card: unemployment rate in France, Germany and Italy"></iframe>Rankings can be embedded too, with the country of your choice highlighted.
Images ready to publish
“Image” on a full-screen card: three formats, line or bars, fitted axis or zero baseline, any period. The producer and the period are in the image, so the source never gets lost on the way.
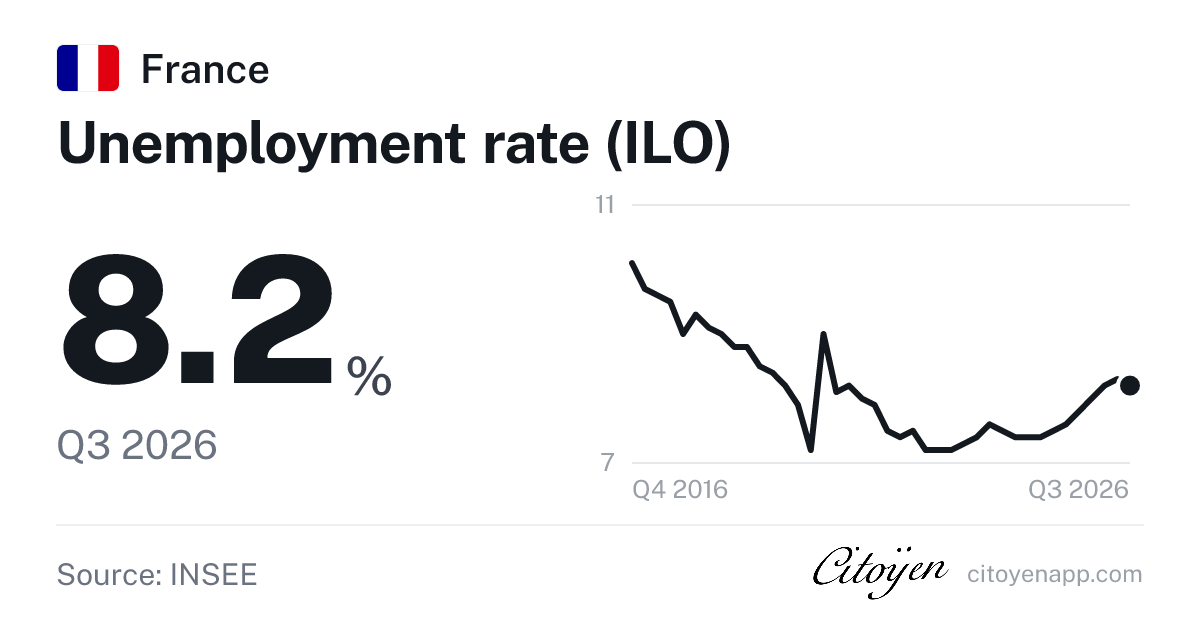
Landscape 1200 × 630 · articles, LinkedIn
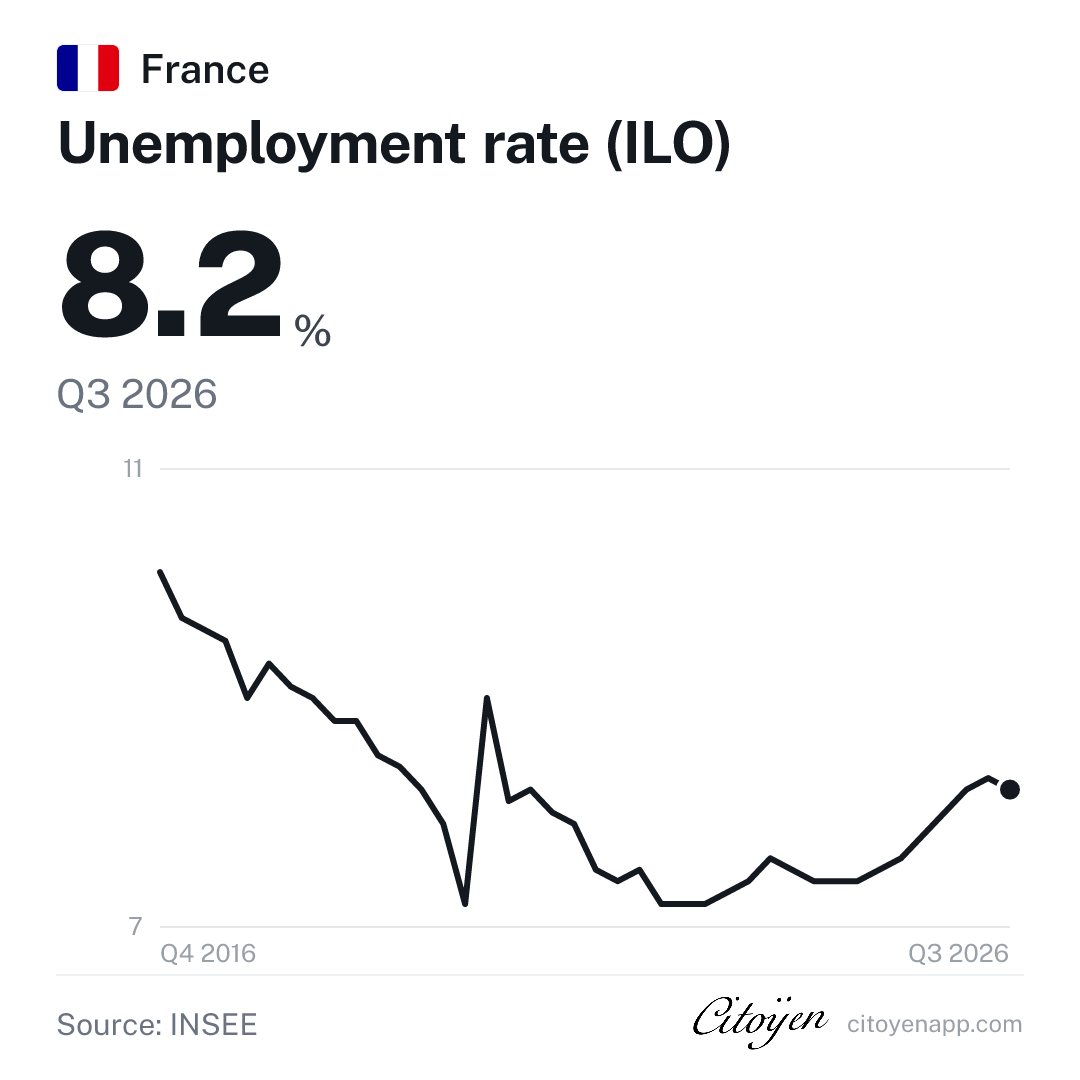
Square 1080 × 1080 · social media
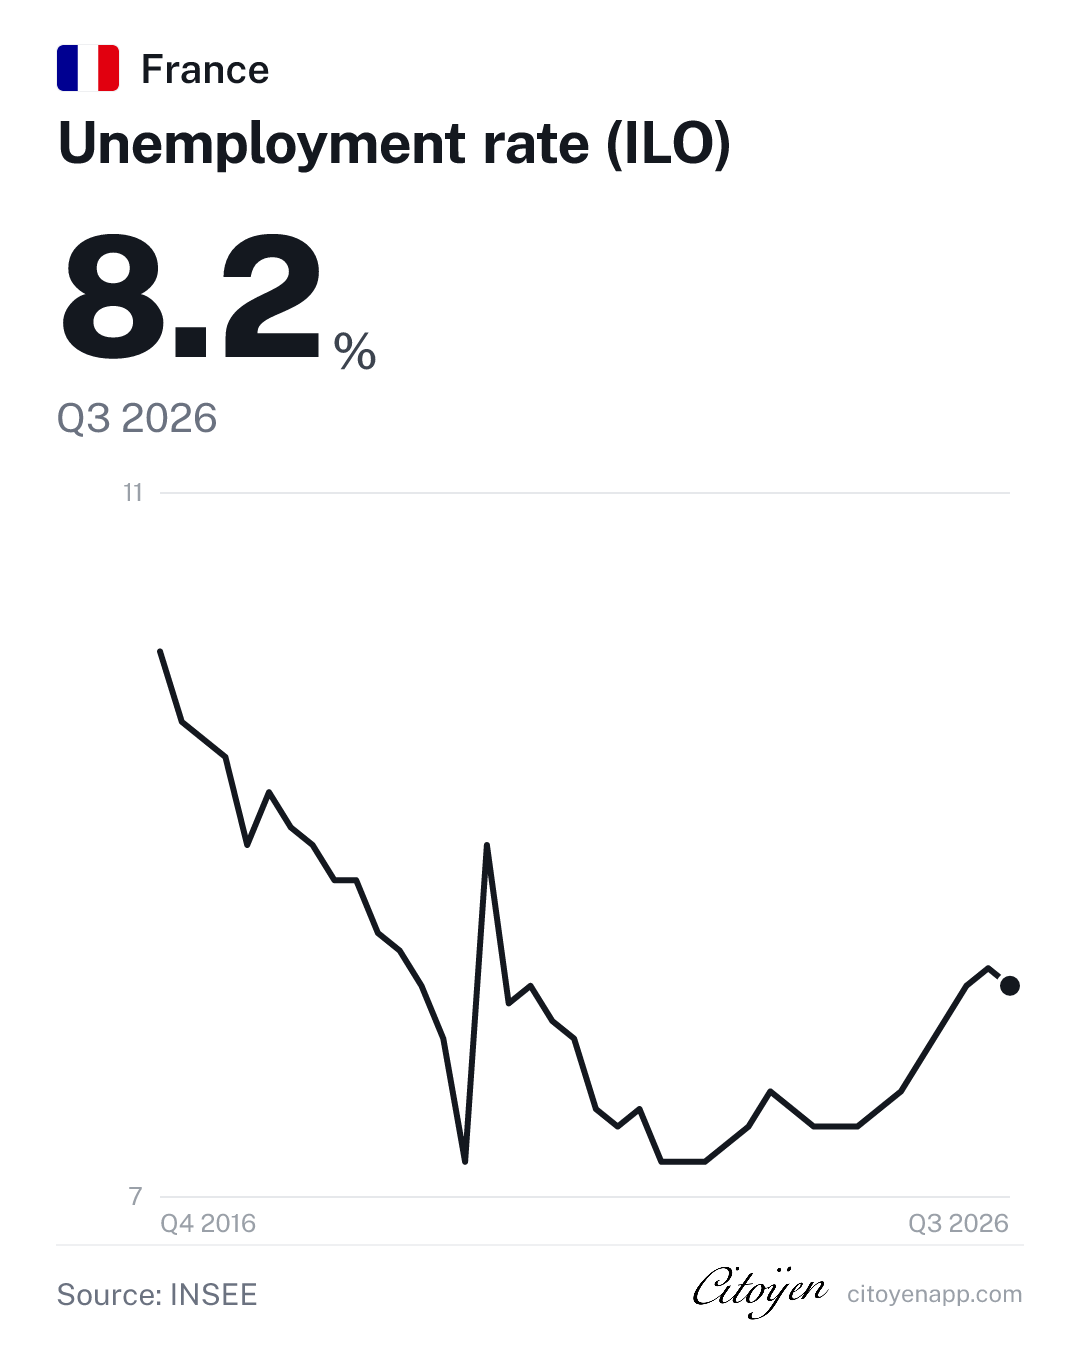
Portrait 1080 × 1350 · stories, slides
The data behind every figure
The original series, in one click
The producer's name under each card opens the exact series on its own site (INSEE, Eurostat, BLS…), so you can check before publishing.
Table and CSV
The Table view of each card lists the values, with a CSV download and a citation ready to copy. Except series from private producers.
Compare and rank
Comparisons between countries and rankings, always drawn from a single harmonised source.
Calendar and alerts
The next releases by country and topic; a bell on the card tells you when the new figure is out.
For data teams
The public MCP server connects Claude, ChatGPT or a notebook to the same series. Developers page →
Public corrections
The corrections log lists every error fixed on the site. Method →
Cite
Cite the official producer, then Citoyen as the place where you read the figure. “Copy citation”, in the Table view of each card, gives the full line:
Citoyen, “France · Unemployment rate (ILO)”, based on INSEE, data to [period]. Accessed [date]. [card link]
In a short text: “Source: INSEE, via Citoyen”.
What you can reuse
- A figure, a seriesFree
- With the producer and Citoyen cited. The producer's licence applies (Licence Ouverte, CC BY 4.0, OGL…): it is stated on its page.
- Embedded cards, downloaded imagesFree with credit
- In an article, a lesson, a presentation, commercial use included, with the credit “Citoyen · producer” and without altering the figure. The credit is already in the image and in the embedded card.
- Series under a restricted licenceLimited
- Private producers and SIPRI military series: latest value and link to the card only, no CSV and no full series.
- Notes, analyses, reform factsheetsShort quote
- An excerpt with the link. No full reproduction.
- Systematic copy of the databaseNot allowed
- By robots or through the MCP server, without written agreement.
In class
Official sources, dated and verifiable, to build critical thinking about figures.
- 1
Compare youth unemployment in France, Germany and Italy, and see why definitions matter.
- 2
Show terms of office and reforms on a line chart, then discuss what a chart does not prove.
- 3
Start from a figure quoted in the press and trace it back to the producer's series.
Press kit
To write about Citoyen: the pitch in three lengths, today's key figures and a folder to download, in the language of this page.
Citoyen brings together the official figures of 19 countries and the European Union on simple cards, updated with each release, to see where each country stands without taking sides.
Citoyen is a free website that tracks the performance of 19 countries and the European Union from their official statistics: national statistics offices, central banks, Eurostat, OECD, IMF, World Bank. Each figure is shown on a card that updates with every release, with its producer and the link to the original series. Around the cards, synthesis notes, reform factsheets and records of each leader's term give the keys to read them, without taking sides. The data is collected and analysed with AI, and checked by a person before publication. Citoyen is published by Mickaël Jordan.
Citoyen is a free website that tracks the performance of 19 countries and the European Union from their official statistics. Growth, jobs, prices, public debt, housing, health, education, security, immigration, energy: thousands of figures are shown on simple cards, one per country and indicator. Each card updates when the producer releases a new figure (national statistics office, central bank, Eurostat, OECD, IMF, World Bank, United Nations) and names that producer, the period and the link to the original series.
The site starts from a simple observation: public figures exist, but they are scattered across dozens of websites, published in different formats and rarely set side by side. Citoyen gathers them in one place, compares them when a harmonised source allows it and says so when it does not.
Around the cards, synthesis notes by country and topic, reform factsheets, in-depth analyses and records of each leader's term give the keys to read them. They do not take sides: they say what the figures show, what they do not show and where they come from.
The data is collected and analysed with the help of AI, and checked by a person before publication; corrected errors are listed in a public log. The site reads in a dozen languages, on desktop and on phones, and every card can be embedded in an article or a lesson, downloaded as an image or read by an AI assistant through the public MCP server.
Citoyen is published in a personal capacity by Mickaël Jordan, a French entrepreneur based in the United States.
The vision and story of the project, in more detail: About Citoyen →
Key figures
19 + EU
countries covered
3,413
published cards
17
categories
13
languages
Computed every day from the published cards.
Citoyen press kit · English
- Logo in SVG and PNG, for light and dark backgrounds, and the app icon
- Share images of the home page and of a few cards, in this language
- Portrait of the founder
- Presentation texts: pitch, bio, key figures, licence, contact
The kit in another language: Français · Español · Deutsch · Italiano · Português · Bahasa Indonesia · Türkçe · Русский · 日本語 · 한국어 · 简体中文 · العربية
Logo


Do not distort or recolour the logo. Use the white version on dark backgrounds.

Mickaël Jordan, founder
A French entrepreneur based in the United States with a background in tech (augmented reality), Mickaël Jordan is Chief Revenue Officer North America at Agicap, a cash management software company. Passionate about open public data, he publishes Citoyen in a personal capacity to explore how AI can renew democratic life.
Press contact: presse@citoyenapp.com